Understanding Financial Statements
Note: Sum of the parts Model not part of the exam
Balance Sheet
A balance sheet is a financial statement that reports a company’s assets, liabilities, and shareholders’ equity at a specific point in time. It encodes the fundamental accounting identity:
Shareholders' Equity
Shareholders’ equity is the residual claim on assets after all liabilities are settled:
It represents the book value of ownership in the firm.
Note: Equity is not a separate pool of cash — it is a derived quantity that forces the balance sheet identity to hold. If assets grow without a corresponding rise in liabilities, equity must increase, and vice versa.
Example of a Balance Sheet:
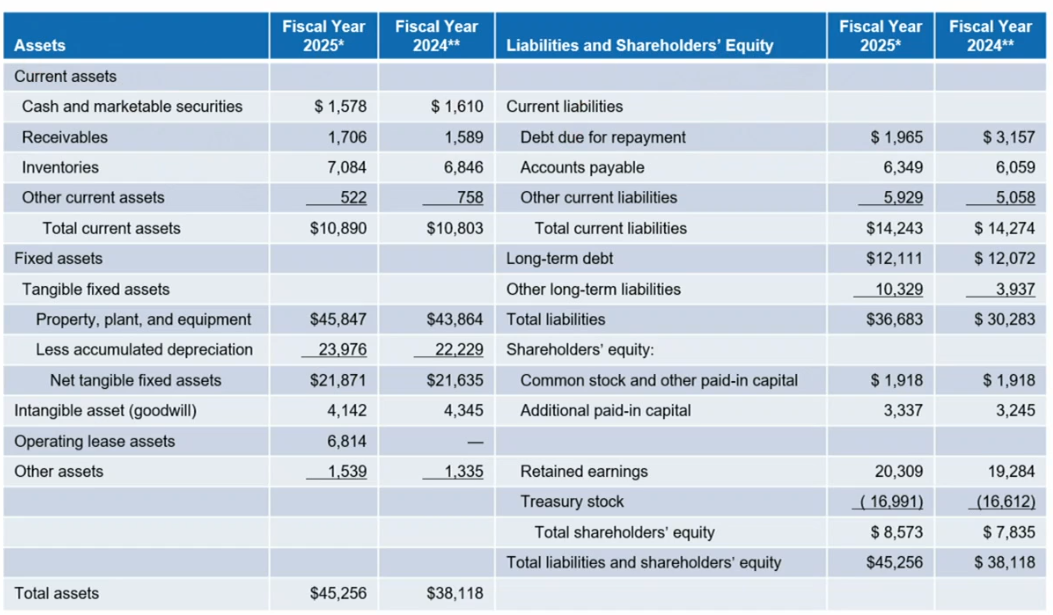
Left: Assets, Right: Liabilities
Current Assets: Term below 1 year, or even 30 days
- Cash: daily operating cash they have
- Receivables: outstanding payments
- Inventories: apples, water, whatever for supermarkets etc.. (Just In Time: limit amount of inventory I have)
Fixed Assets: - properties, plants, machines
- less accumulated depreciation → you can deduct depreciation of assets from taxable income → write off the cost of an asset over it’s useful life, reducing tax bill
- Net tangible fixed assets
- intangible assets: know-how, etc…
Current Liabilities: less than a year
- debt due for repayment
- accounts payable (pay as late as possible → gives you “funding” for nothing)
- you have cash you can put to work → i.e. earn interest/profit from it. So if you repay later you get more
- Other current liabilities: short term loan, etc…
Long term debt - longer time loans, bonds, etc…
Shareholder’s equity: - Common Stock
- face value of all issued shares ever (usually tiny nominal value)
- Additional paid-in-capital
- IPO or issue shares → investors pay more than face value (difference between common stock value and initial share price you sold for)
- Retained earnings: money you keep (pay dividends, repurchase stock → but you keep some)
- all cumulative profits ever earned - dividends
- Treasury Stock
- take stock out of the market (buy back) → give more dividend to remaining stockholders
- negative as buybacks reduce equity
Net working Capital
difference between current assets and current liabilities
- if < 0 usually sign of distress
- for retail (Kroger Co. from example) normal, as they basically sell inventory they haven’t paid the suppliers for.
Note: this excludes fixed assets and liabilities
Example (Constructing a Balance Sheet): Constructing the balance sheet for Galactic Enterprises:
| Assets | Liabilities & Equity | ||
|---|---|---|---|
| Cash | $25,000 | Accounts payable | $24,000 |
| Accounts receivable | $35,000 | Long-term debt | $130,000 |
| Inventories | $30,000 | Total Liabilities | $154,000 |
| Net plant & equipment | $140,000 | Shareholders’ equity | $76,000 |
| Total Assets | $230,000 | Total L + E | $230,000 |
| Shareholders’ equity is the plug: |
This means that if Galactic Enterprises liquidated all assets at book value and repaid every creditor, $76,000 would remain for shareholders.
Debt on the Balance sheet
Gross vs. Net Financial Debt
Net financial debt = (gross financial debt) - (cash & equivalents)
The gross financial debt being: bank loans, bonds, leases, etc… → matters for legal obligations and refinancing risk
net debt is important for valuation
Aside (Depreciation)
The tax authority defines useful life of an asset.
For a laptop useful for 5 years, you can depreciate it total cost / total years = $200/year for example (straight line).
Then you can deduct this from your taxable income (i.e. if you have 5k taxable, you now only have 4.8k). This saves $60 per year at 30% tax rate.
EBITDA
EBIT
Earnings before interest, taxes
is same as ebitda but without removing depreciation and amortization
EBIT = Revenue − COGS − Operating Expenses
Note: Debt interest is paid out of pre-tax income!
EBITDA
EBITDA (Earnings Before Interest, Taxes, Depreciation, and Amortisation) is a measure of a company’s core operating profitability, excluding the effects of financing decisions, tax environments, and non-cash accounting charges. It is computed as
or equivalently, starting from net income:
where depreciation accounts for the gradual expensing of tangible assets and amortisation for intangible assets (e.g. patents, goodwill).
COGS: Cost of goods sold
Example: A firm reports net income of , interest expense , taxes , depreciation , and amortisation . Then
If the enterprise value is \600\text{m}8\times$.
Measuring Performance
Two key metrics are used to assess how much value a company has created for its shareholders.
Market Capitalisation
The market capitalisation of a firm is the total market value of its equity, computed as
It represents what the stock market currently believes the equity of the firm is worth.
Example: For Kroger Co. (fiscal year 2025), with 788 million shares outstanding at a price of $27.55 per share:
Market Value Added (MVA)
Market Value Added is the difference between a firm’s market capitalisation and the book value of its equity:
Read MVA:
- Positive MVA: indicates the firm has created value beyond what shareholders originally invested
- Negative MVA: indicates value destruction
The book value of equity is taken directly from the balance sheet — it reflects the historical accounting value of shareholders’ funds (paid-in capital + retained earnings − treasury stock).
Example: Kroger’s balance sheet (fiscal year 2025) reports total shareholders’ equity of $8,573 M. Combined with the market cap computed above:
This means the market values Kroger’s equity at roughly $13.1 billion more than its accounting book value, reflecting investor confidence in the firm’s future earning power.
Market / Book Ratio
Ratio between market capitalisation and book valuation.
Note however: share buybacks reduce the book value of equity → the denominator shrinks closer to 0 and increases this ratio.
This makes it difficult to interpret.
this is because a buyback decreases assets (cash used to buy shares) and become “treasury stock” → recorded as contra-equity
so the shareholders equity shrinks by that amount
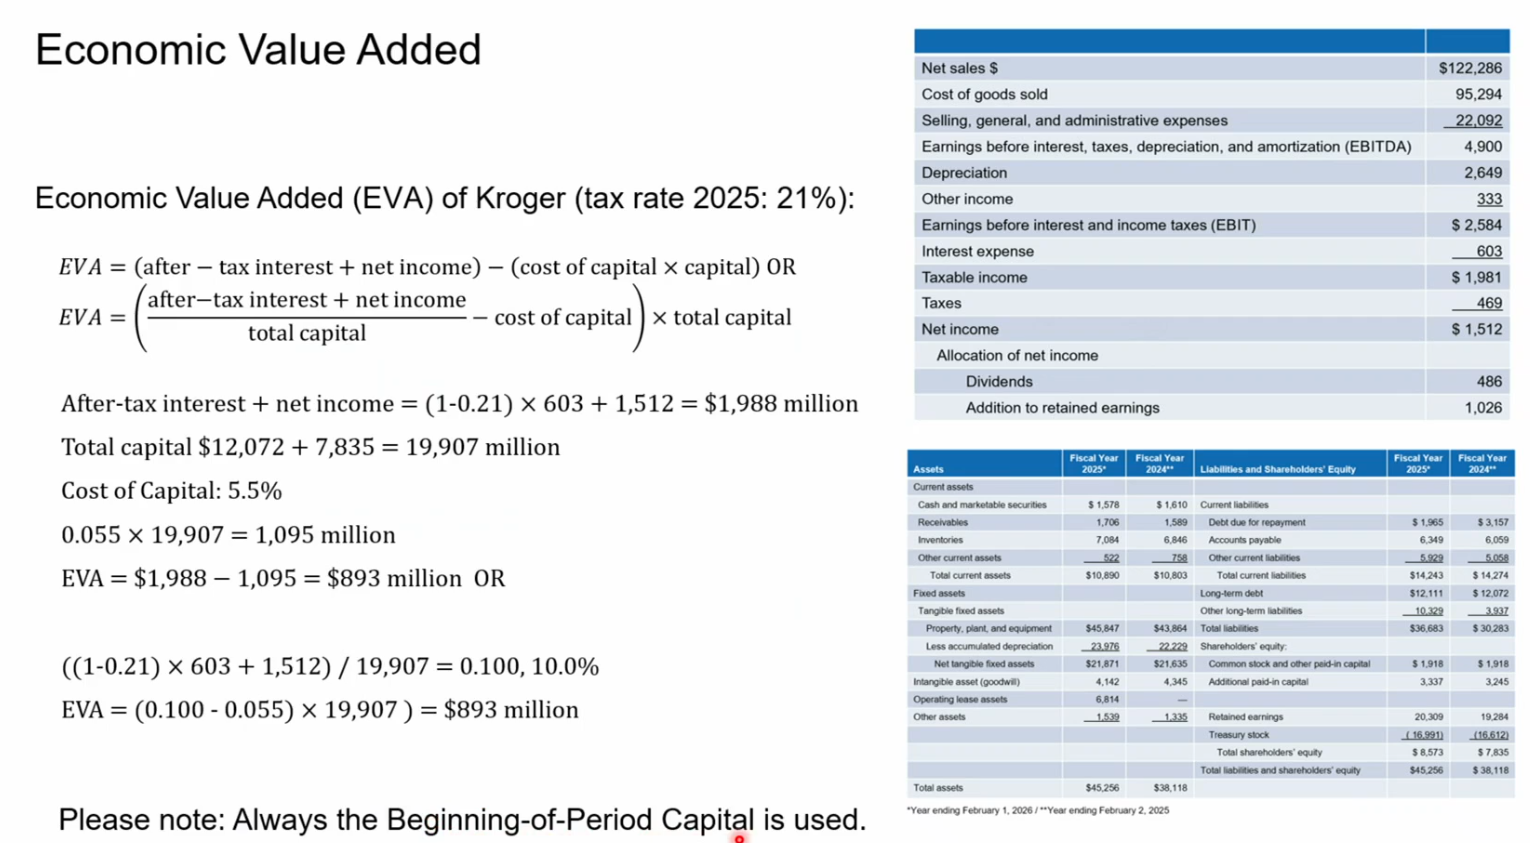
EVA
Economic Value Added
Net income minus a charge for the cost of capital employed (also called residual income)
Residual Income: net dollar return after deducting cost of capital
Intuitive: measures whether a company is generating returns above and beyond what it’s capital actually costs: “after paying all suppliers of capital → did we destroy or create value”.
Total earnings: company generates value for
- debt-holders (banks, bondholders → they get interest payments)
- equity-holders (shareholders) → they get net income
So total earnings = after-tax interest + net income
Total Capital: use the capital at the beginning of the period (this periods value was generated from the capital we had before that period)
Cost of capital: (also called WACC)
WACC
(weighted average cost of capital) combines what debtholders and equity holders demand
where E = market value of equity, D = market value of debt
V = E + D
r_E = cost of equity
r_D = cost of debt
T = corporate tax rate
After-tax Interest: you pay taxes on (income) - (interest expense) → government subsidises debt. Why do we do this? We want to compare what the return would have been with “all-equity financing”! → WACC already has taxes incldued
Therefore, we need to “after-tax” it, to make sure we use the right values.
The factor is the after-tax adjustment using a 21% corporate tax rate.
- gives ((gross income) - (interest))(1 - 0.21) = net income
⇒ gross income = net income + interest*(1 - 0.21).
EVA Advantage: it accounts for the cost of capital
Note: EVA can be skewed through share repurchases:
- EVA = NOPAT - (WACC * Invested Capital)
The invested capital gets distorted downwards → share buybacks reduce equity (even negative sometimes, McDs or Apple) - thus EVA is inflated, since WACC * Invested Capital decreases
→ This means that the book equity after share buybacks no longer reflects what was “really invested into the company”!
Accounting Rates of Return
Because the EVA depends on the amount of capital the manager has, it’s not easily comparable. To do so, we use the accounting rates of return:
Three metrics measure how profitably a firm deploys its resources. All use after-tax figures to put debt and equity on the same footing. The tax rate used here is (US corporate rate).
Return on Capital (ROC)
Return on capital measures profitability relative to the funds provided by all capital suppliers (debt + equity):
The after-tax interest add-back neutralises the tax shield, so debt and equity are compared on equal terms. Total capital = long-term debt + shareholders’ equity (excludes operating liabilities).
Assume WACC was 5.5%. So a 10% ROC would mean the company outperformed expectations by 4.5%.
Return on Assets (ROA)
Return on assets uses the same numerator but a broader denominator — all assets, regardless of how they are financed:
Because total assets total capital, ROA ROC for the same firm.
Return on Equity (ROE)
Return on equity measures what flows to common shareholders per dollar of book equity:
No interest add-back is needed because the numerator already belongs entirely to equity holders. Financial leverage typically pushes ROE above ROA.
If ROE > cost of equity capital (what is used by WACC as well, calculated with CAPM usually), then the company performed well.
Note: a more highly leveraged company will have a higher ROE, but a lower ROA than it’s peers, since the leverage magnifies the lower ROA into a higher ROE.
Example (ROC, ROA, ROE):
| Item | Value |
|---|---|
| Net income | \1{,}512$ |
| Interest expense | \603$ |
| Tax rate | |
| Total assets | \38{,}118$ |
| Shareholders’ equity | \7{,}835$ |
| Total capital (LT debt + equity) | \19{,}907$ |
The gap between ROE () and ROC () illustrates the effect of financial leverage: equity holders bear concentrated risk, so their accounting return is amplified. ROA is lowest because it spreads the same earnings over all assets, including those funded by cheap operating liabilities like accounts payable.
Pro/Con with EVA and Accounting Rates of Return
Con:
- unlike market-value based measures, they show current performance and are not affected by the expectations about the future
- not every asset is shown
- brand name
- in some industries EVA/ROI are negative
- pharma research programs
- Balance sheet does not show current market value of firm’s assets
- Book equity is reduced when companies repurchase stocks
- creates non-sense measure of EVA
→ So you better hope the accounting data is accurate!
- creates non-sense measure of EVA
Pro:
- Can be calculated for private companies (no observable market value)
Measuring Efficiency
Asset Turnover Ratio
The asset turnover ratio measures how efficiently a company uses its assets to generate sales.
Profit Margin
The profit margin measures how much out of every dollar of sales a company actually keeps in earnings.
this is unfair to companies that are debt-financed, because part of the sales flows into debt repayment. Thus we look at operating profit margin:
Operating Profit Margin
The operating profit margin measures the earning power of operations, independent of how the company is financed (e.g., if it had no debt). After-tax interest is added back to net income to strip out financing effects.
Inventory Turnover Ratio
The inventory turnover ratio tells how many times a year a company sells and replaces its entire stock of inventory.
Inventory Period
The inventory period converts the turnover ratio into days — it tells exactly how long a specific item sits on the shelf before a customer buys it.
Receivables Turnover
The receivables turnover tells how many times per year a company collects its average accounts receivable (the money owed to them by customers).
Accounts Receivable Period
The accounts receivable period converts the turnover into days — it tells exactly how long it takes, on average, to receive payment after a sale is made.
Accounts Payables Period
The accounts payables period.
Measuring Leverage
Long-Term Debt Ratio
The long-term debt ratio measures the proportion of a company’s long-term capital that consists of debt:
A ratio of 0.59 (59%) means 59% of long-term capital is financed by debt.
Note: (According to mock-exam) Leases are part of the long-term debt, i.e. have to be added into both num. and denum.
Long-Term Debt–Equity Ratio
The long-term debt–equity ratio compares long-term debt directly to equity, and is a key measure of financial solvency:
Unlike the debt ratio, this is not bounded by 1 — a ratio above 1 means debt exceeds equity.
Total Debt Ratio
The total debt ratio measures what fraction of a company’s assets are financed by creditors rather than shareholders:
Times-Interest-Earned Ratio
The times-interest-earned ratio measures how easily a company can cover its interest expenses out of operating profits:
where EBIT is earnings before interest and taxes. A higher ratio indicates a larger buffer against default.
Cash Coverage Ratio
The cash coverage ratio refines times-interest-earned by adding back depreciation — a non-cash expense that did not actually leave the bank account — to give a more accurate picture of cash available to service debt:
Since depreciation is added back, the cash coverage ratio is always the times-interest-earned ratio. The gap between them reflects the size of non-cash charges relative to interest obligations.
The Du Pont System
The Du Pont System breaks down ROA (and ROE) into component ratios — asset turnover and operating profit margin:
we want a high asset turnover and high profit margin → increases total ROA.
Extended Formula: Leverage Ratio * Asset Turnover * Operating Profit * Debt burden
Mergers and Du Pont
Vertical Integration to increase profit-margins offsets this by also decreasing asset turnover!
If we vertically integrate a supplier that only sells to us → profit increases by their profit, but we also have more inventory → compensates the turnover.
So we gain nothing!
Measuring Liquidity
NWC (Net working capital)-to-total-assets current assets - current liabilities is equal to NWC / (total assets)
NWC =
Current Ratio
current ratio = current assets / current liabilities
If the exam gives extra figures such as “inventory” or “accounts receivable” next to current assets and current liabilities, these are already in there. They do not have to be added again.
Quick ratio
quick ratio = cash + marketable securities + receivables / current liabilites
This measures how liquid you are
as non-cash/security assets might often not sell at above fire-sale prices in times of distress.
Thus you want to know how much of your liabilities you can pay back from very liquid assets only.
Cash Ratio
cash-ratio = cash + marketable securities / current liabilities
How much cash is part of your current liabilities
Extra
Total Long-term Capital
Total long-term capital = long-term debt + total-equity
all capital that funds a company’s long-term assets and operations
Capital Charge
Capital Charge = Invested Capital * WACC
where invested capital = long-term-capital (long term debt + equity)
and WACC is 0.05 for 5% not 1.05
Calculate After-Tax Interest + Net Income
If we know the operating profit marging and total sales + interest payments we can get
after-tax interest + net income = (1 - t) * (margin * total-sales + interest-payments)
After-Tax Interest + net income
WARNING
This is not (1 - t) interest + (1 - t) income, it’s simply (1 - t) income!
This is because the interest is first subtracted from the income, then the tax-shield is added back.