UBS has two sides
- Global Banking (GB) → private information from clients, etc…
- global markets → quant, trading, etc… (public information)
US is biggest market, biggest M&A fees
M&A
There are 2 reasons:
- revenue reasons
- accelerate growth, enter new markets, diversify
- better products (see Pharma Acquisition)
- cost reasons (cost synergies, avoid new competitors, increase purchasing power)
- economies of scale
- vertical integration
There are two main legal classifications:
Merger
“Legal” transaction
Two companies combine all assets and liabilities.
one will survive → other is incorporated in.
Merger is more difficult regarding tax (than acquisition)
- international → exit tax
Acquisition
two ways:
- stock purchase (easy legal transaction)
- asset purchase (acquires explicit assets)
- only assumes liabilities of the target that have been specifically determined
- lots of legal precision required
Note under public M&A rules, either a merger or public offer is more advantageous (approval threshold, interloper risk when doing an acquisition)
Other Classifications
- nature of target (public, private, public subsidiary)
- geography (international, national)
- strategy (bolt on, transformational)
- type of consideration (cash, stock, mix)
- process type (bilateral discussion, limited auction, broad auction)
- pro-forma ownership (merger of equals, outright acquisition)
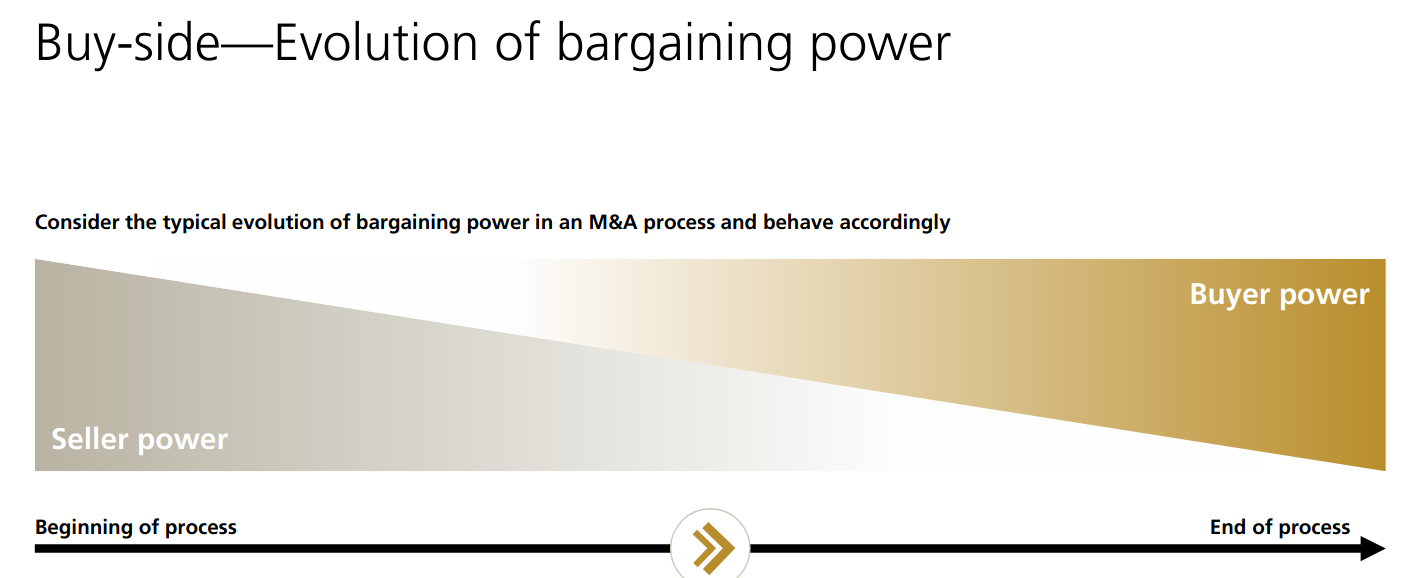
M&A sell side process
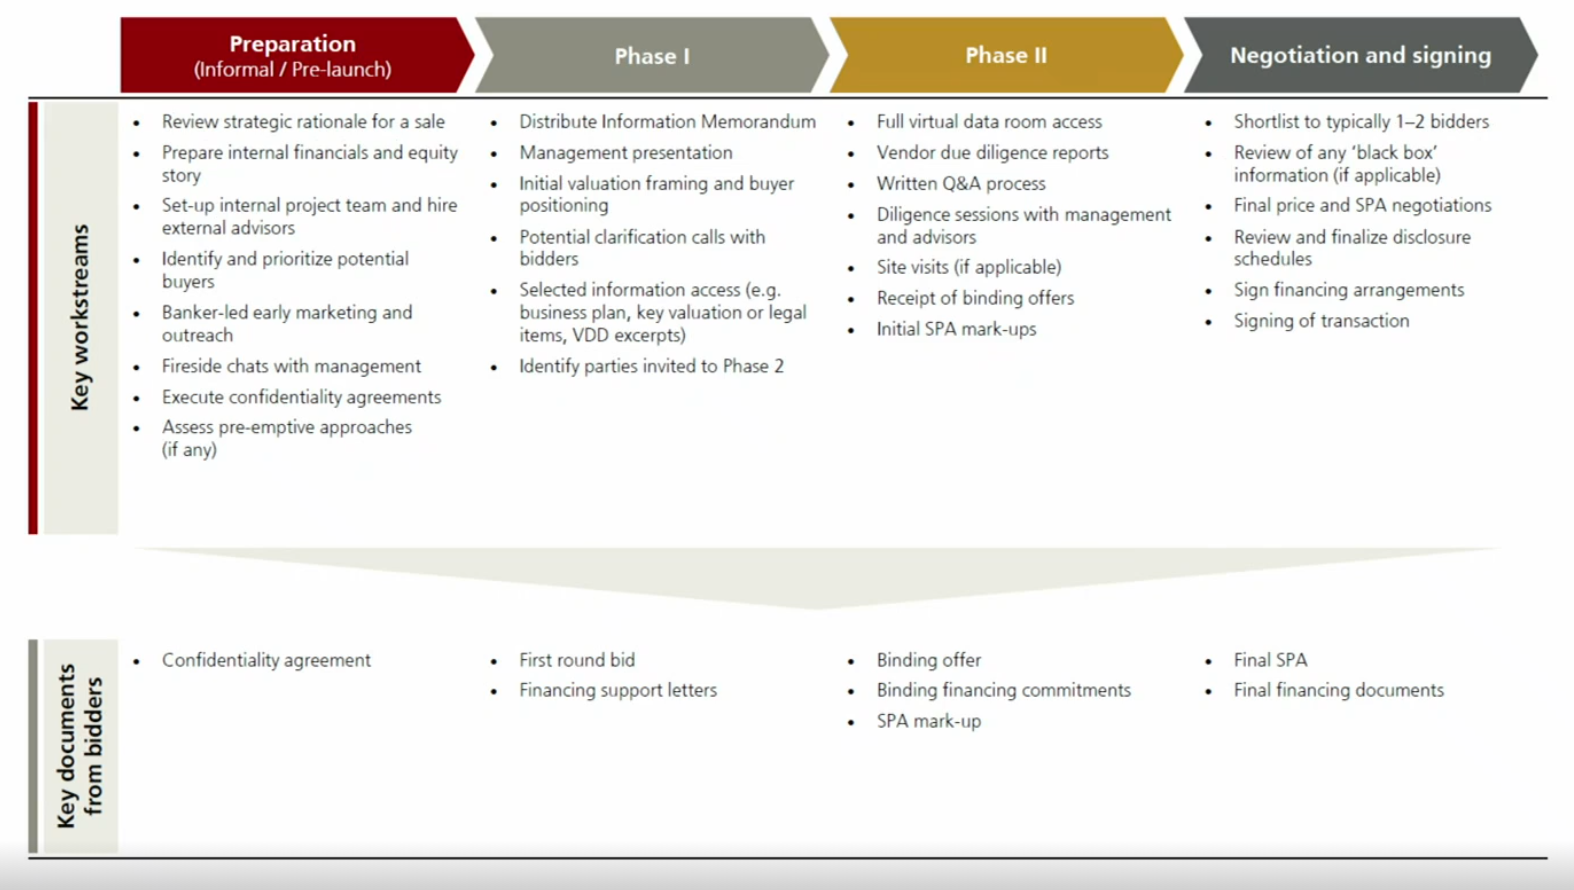
very careful of how to approach this:
- if you’re selling, why? is something wrong?
→ careful framing planning
Due Diligence Report → large document from external vendor, commissioned by external vendor
recently: change of more casual approach → more preparation, informal approaches
Foreign Players in US → not easy. You almost have to have a local bank, otherwise investor pool will ask questions
- US banks are cohesive in not helping out foreign banks
- US banks don’t compete on fees → almost “monopoly”
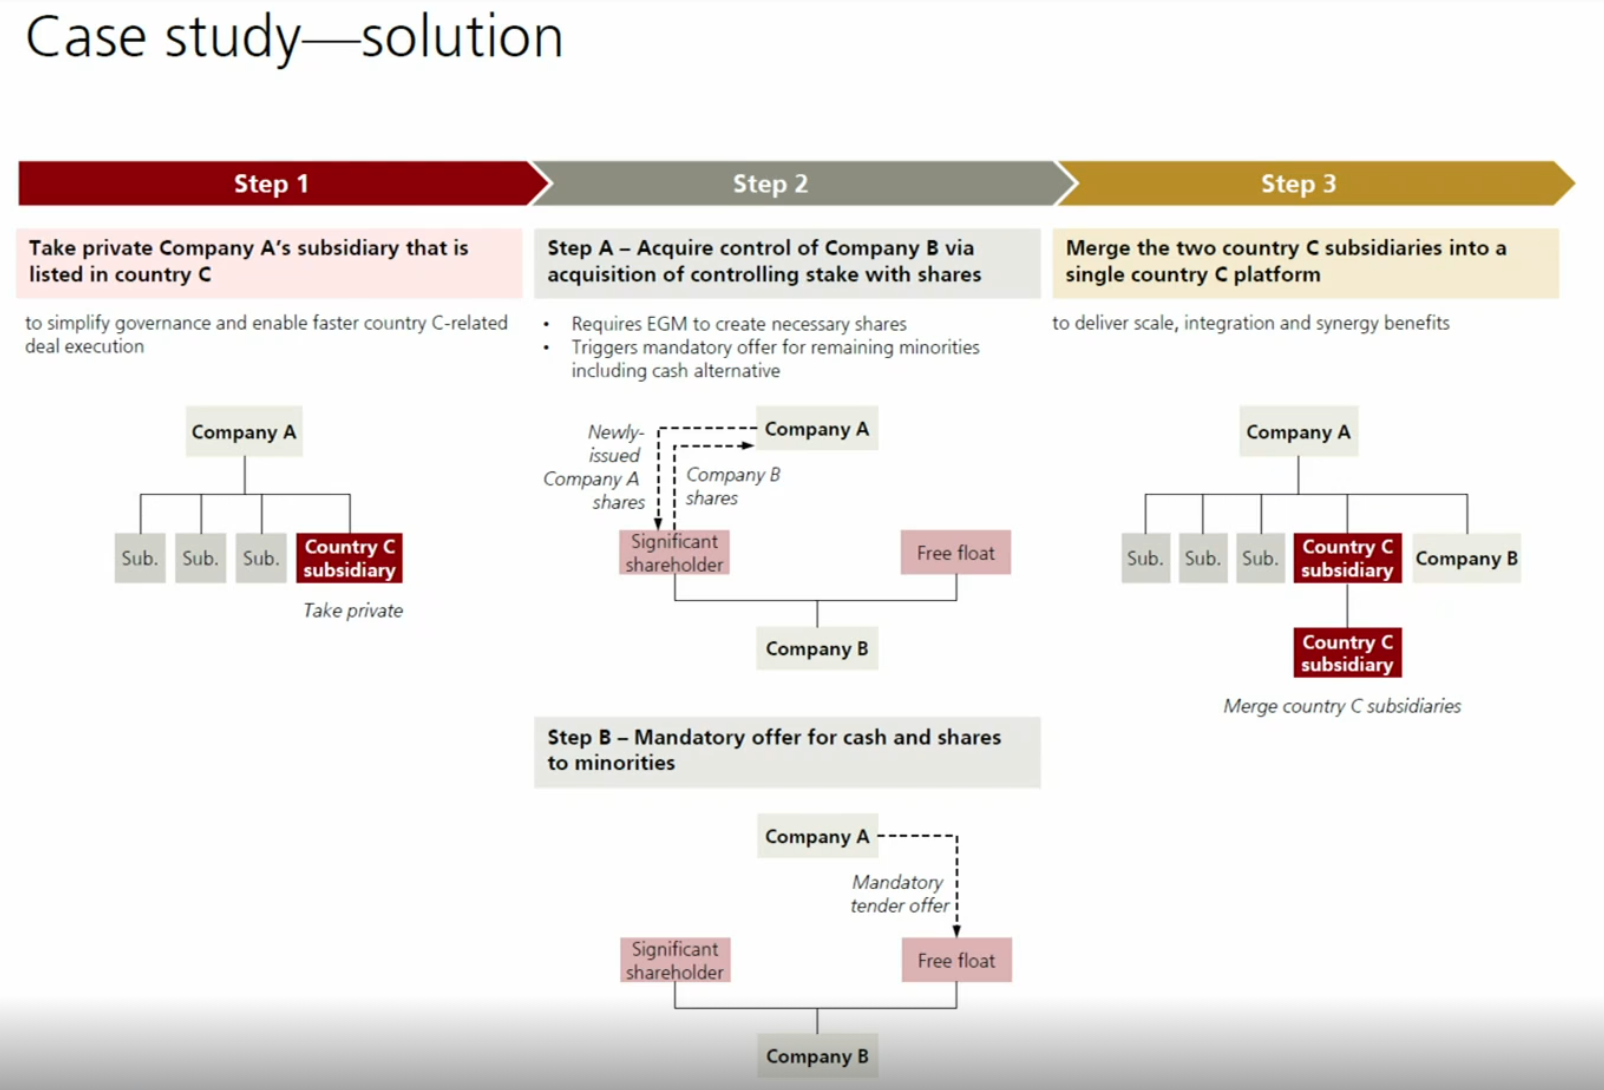
Case Study
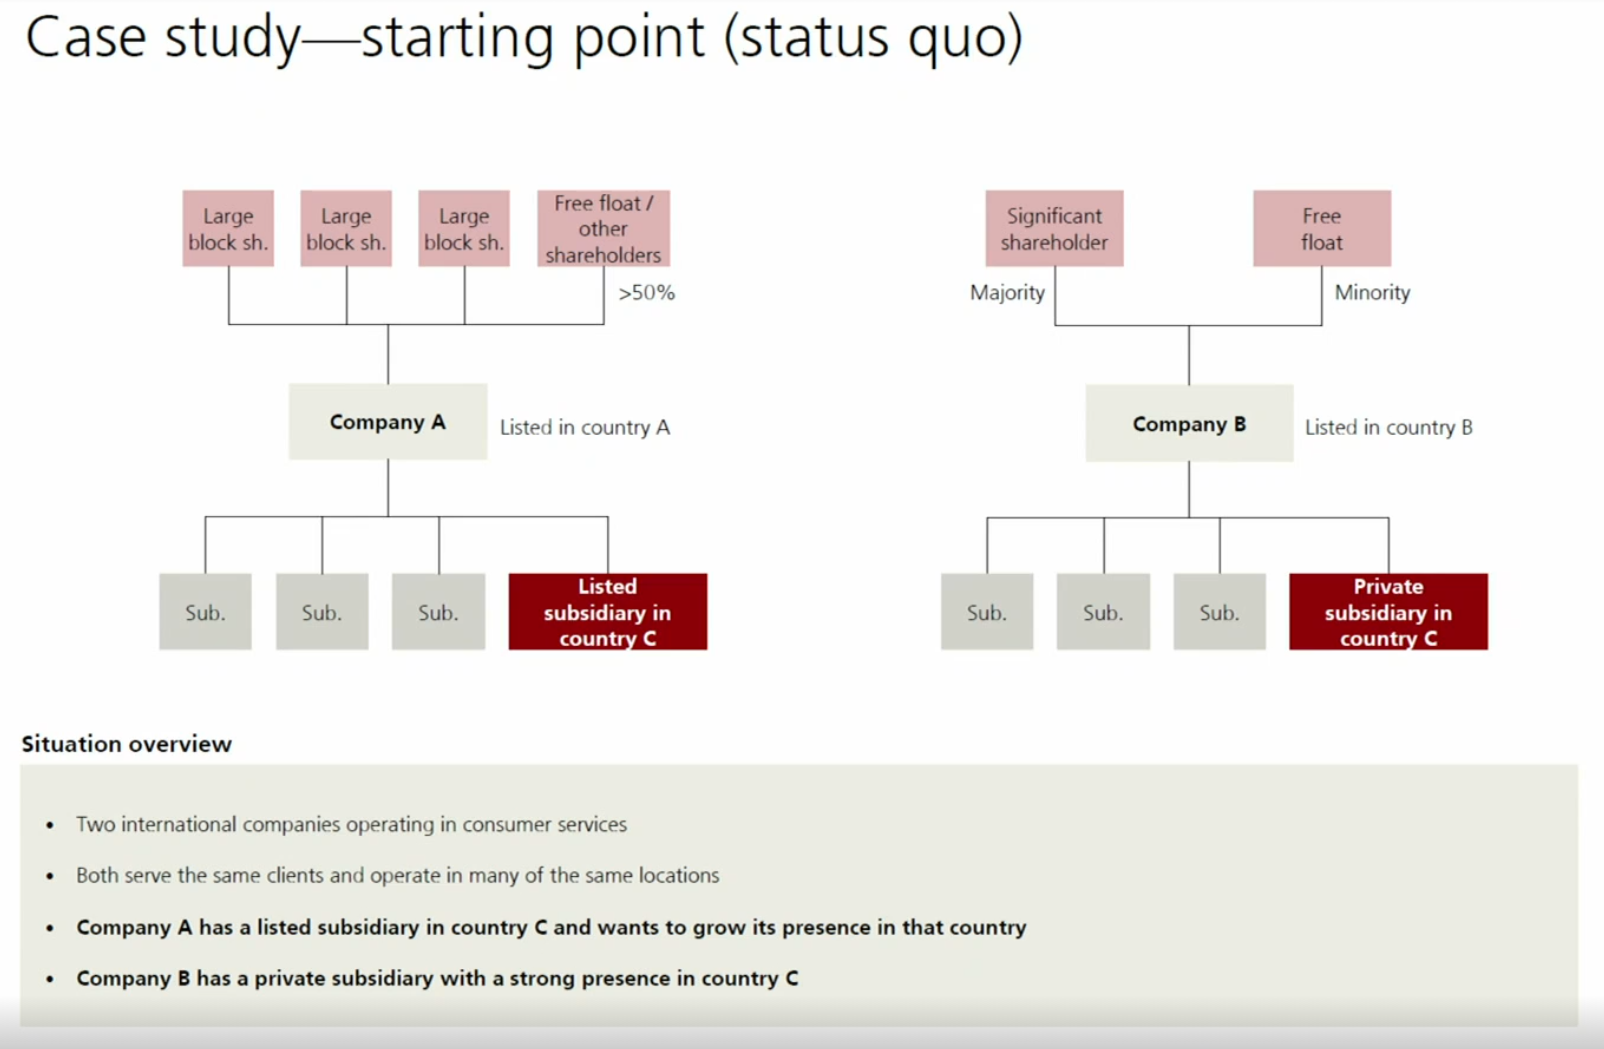
adjacent spaces, not same area but same clients, etc…
two shareholders (private, public)
Note:
- B’s subsidiary is very valuable (majority of value of B)
- B’s subsidiary also much larger than A’s presence in the country
Qs:
- integration, competition issues, legal ramifications
- who should be the buyer (A, subsidiary, other)?
- → they decided listed company A should buy
- who should be target (B, subsidiary)
- → company B now
Enterprise Value (EV) vs. Equity Value (EqV)
Interesting: We always use public valuation for Equity Value (not face value of equity) when valuing assets
- but for debts, we don’t use public value but face value!
- weird, because this massively impacts
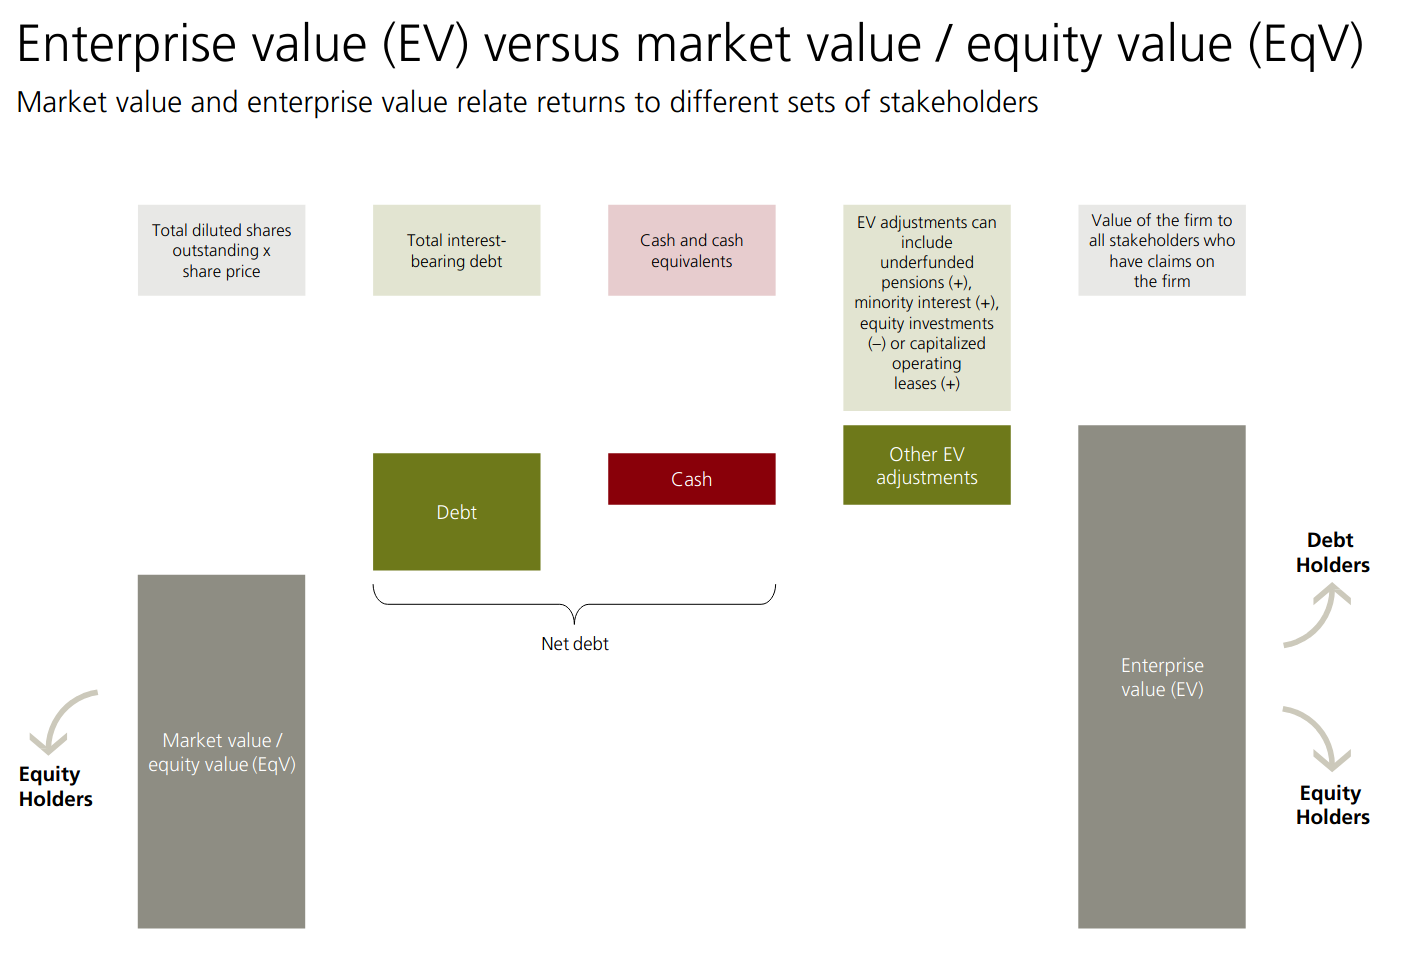
EqV = share price * diluted shares outstanding (value belonging to equity holders only, i.e. shareholders)
Right side: EV = value of the firm to all stakeholders (debt holders + equity holders)
To calculate EV = EqV + Debt - Cash + Other EV adjustments (so positive for Debts, negative for assets)
- equity investments in associates → decreasees the Other EV adjustments
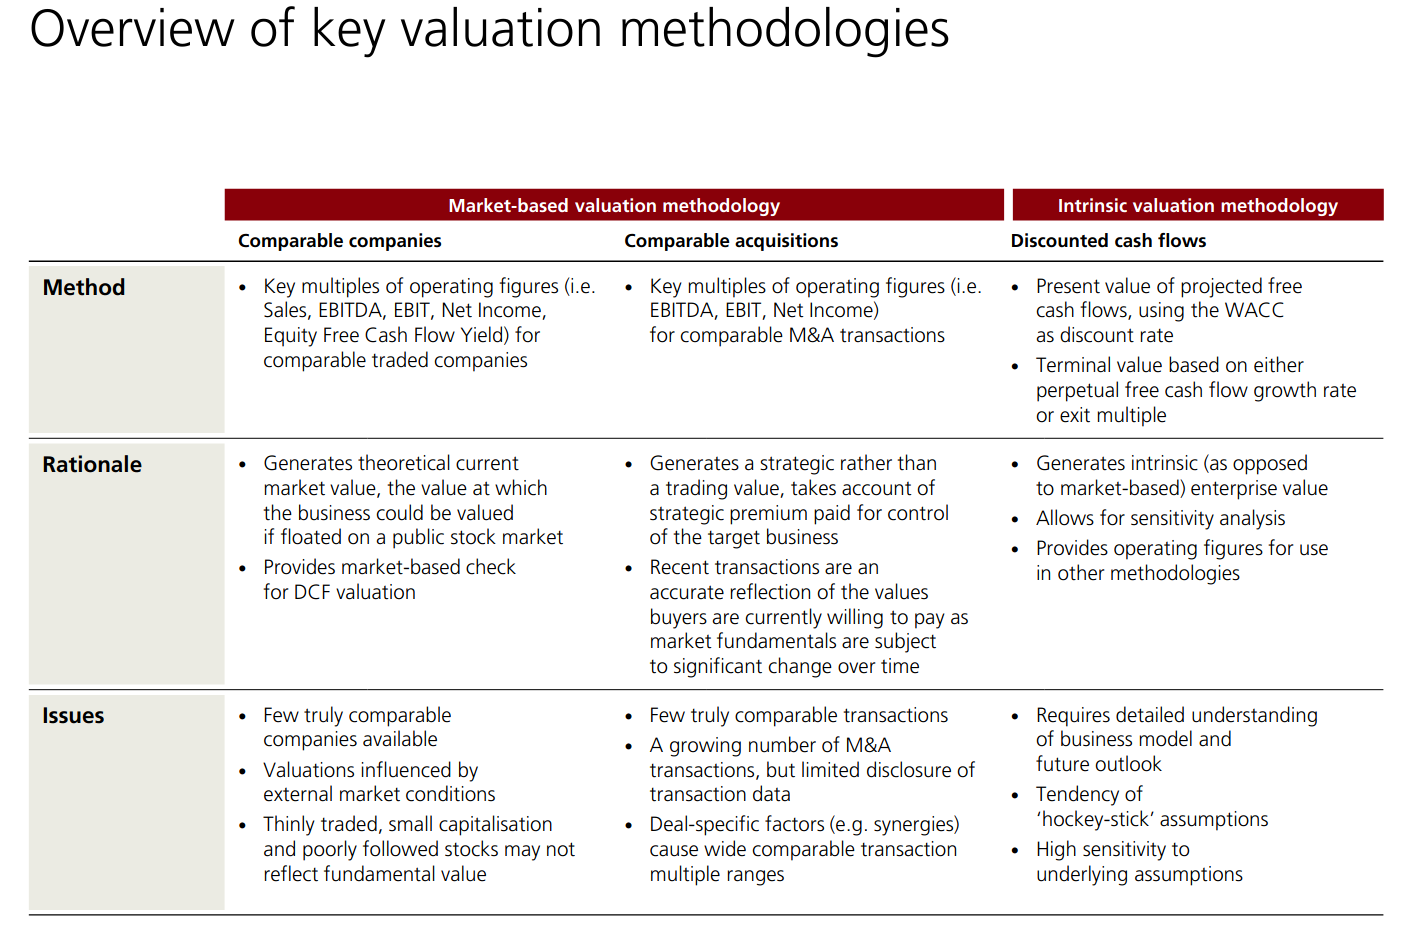
Discounted Cash Flow (DCF) Analysis
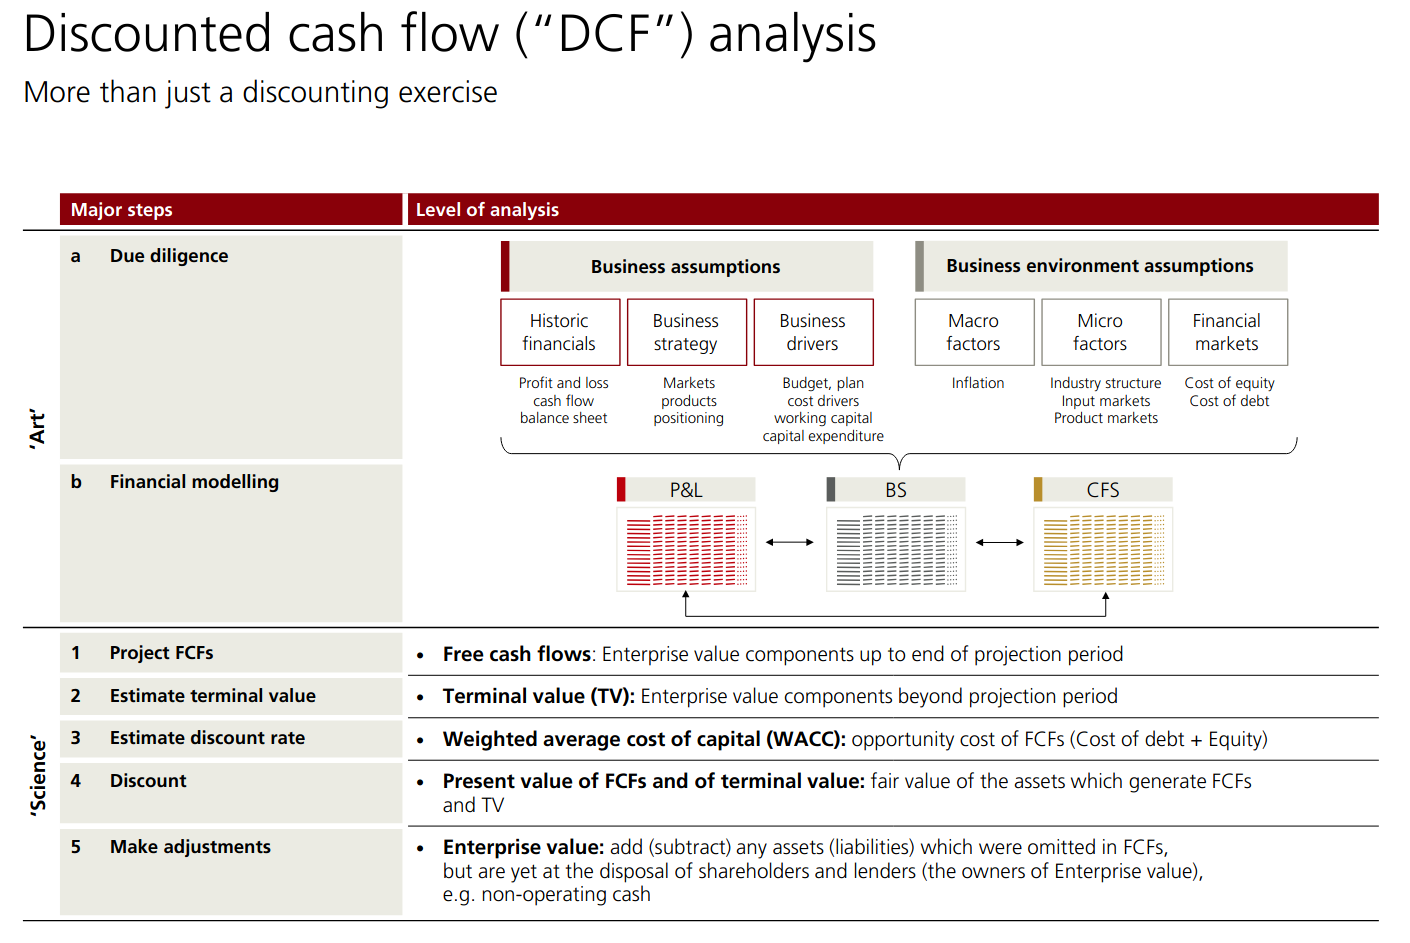
There’s a lot of “art” when doing the fundamental assumptions, that influence the hard math models.
UBS always does a DCF
- not for pure dollar values
- play out different scenarios (ukraine spillover into eastern european countries for acquisition with assets in that region for ex)
→ Looking at the volatility of the value rather than number
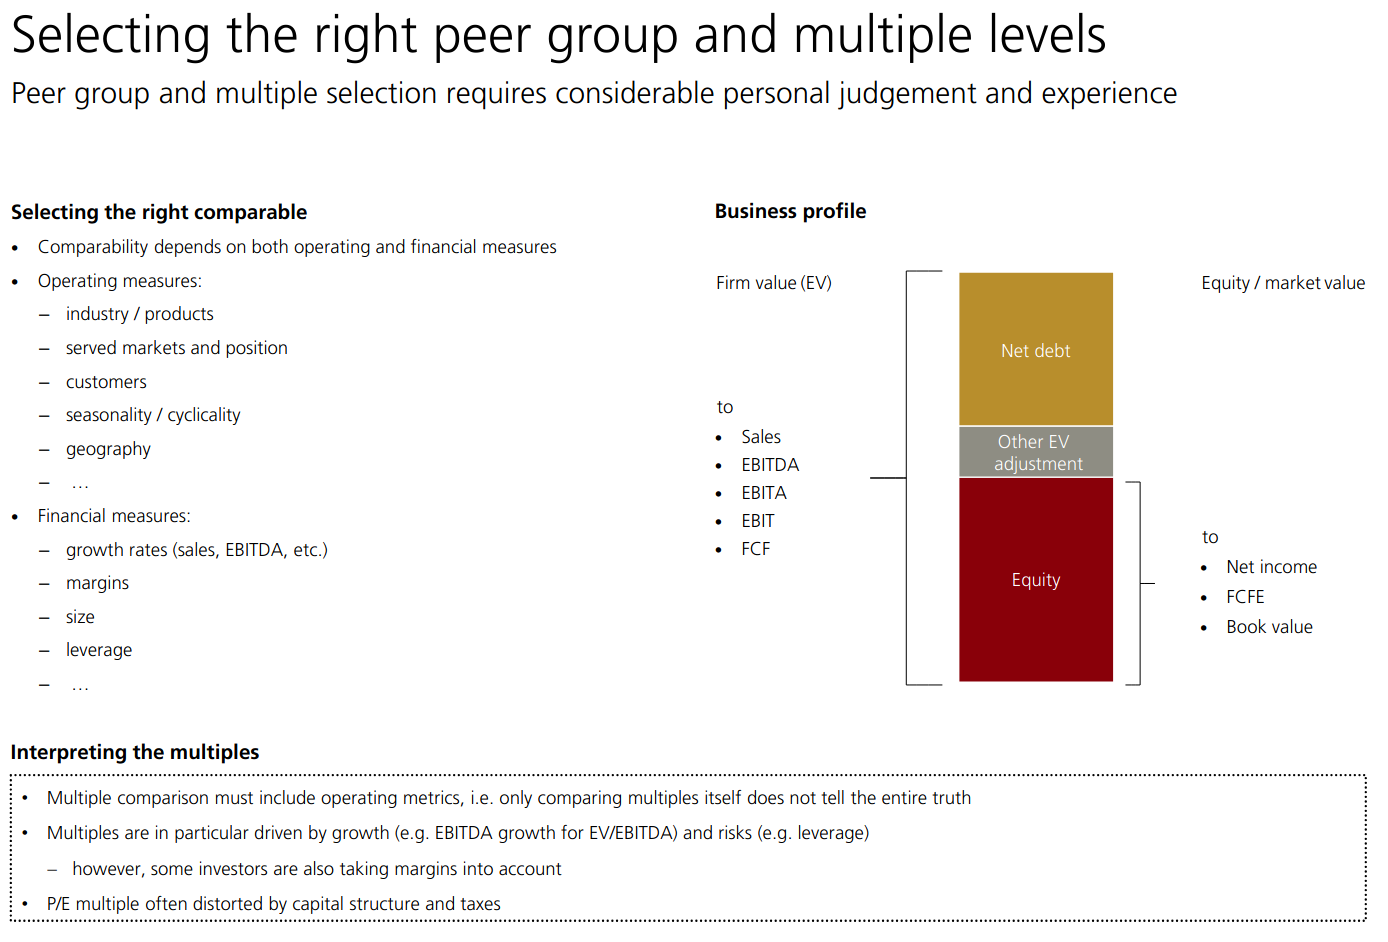
They look at EV / EBITDA → kind of cashflow.
but this is different for each industry
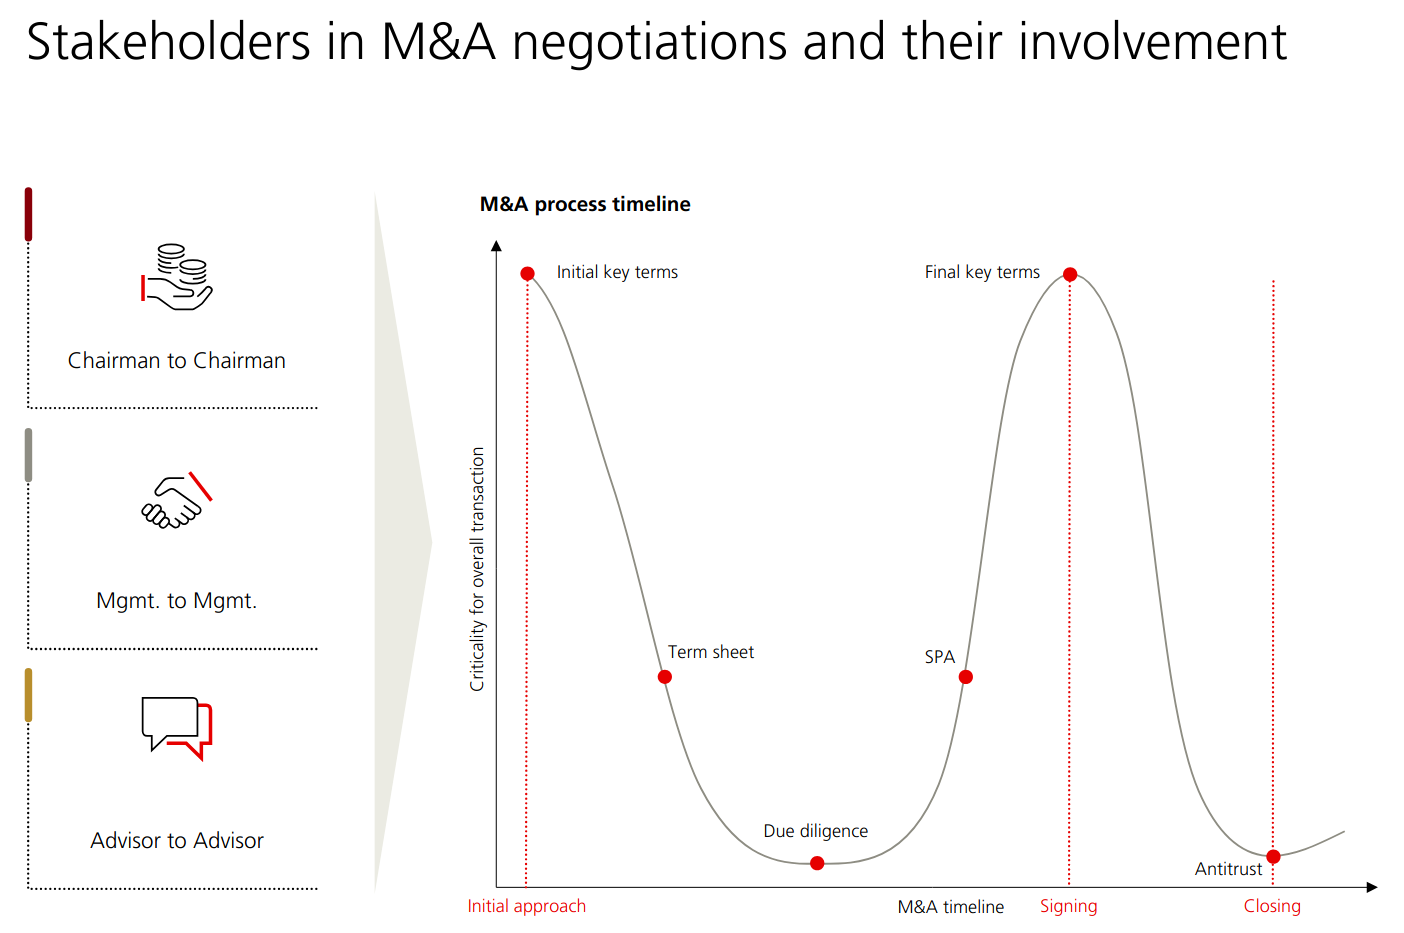
Negotiation Considerations
bankers try to find the deal that works for both parties → very easy to walk away from a deal
Potential Stakeholders
- shareholders, board of directors, management, employees
- external:
- clients:
- research analysts
- capital markets
- unions
- buyer/seller
- rating agencies
- regulators
- general public
- and for both: press, proxy advisors
- clients:
Negotiations are different amongst stakeholders:
- chairman to chairman
- focus on few items → define the transactions
- face to face in person
- mgmt. to mgmt
- more detailed negotiation
- control and oversight function
- advisor to advisor
- negotiate and implement the high-level terms agreed upon by chairmen and management
- support them in tactics and likely outcomes
- → they have experience
They all have a potential hidden agenda
difference in culture
- roche, etc… have entire teams
- some countries different process
Extra
Short
Legal Classifications:
- merger: combines all assets and liabilities into one surviving entity
- stock purchase: buyer acquires stock to control all assets and liabilities
- asset purchase: buyer acquires explicitly determined assets and specific liabilities
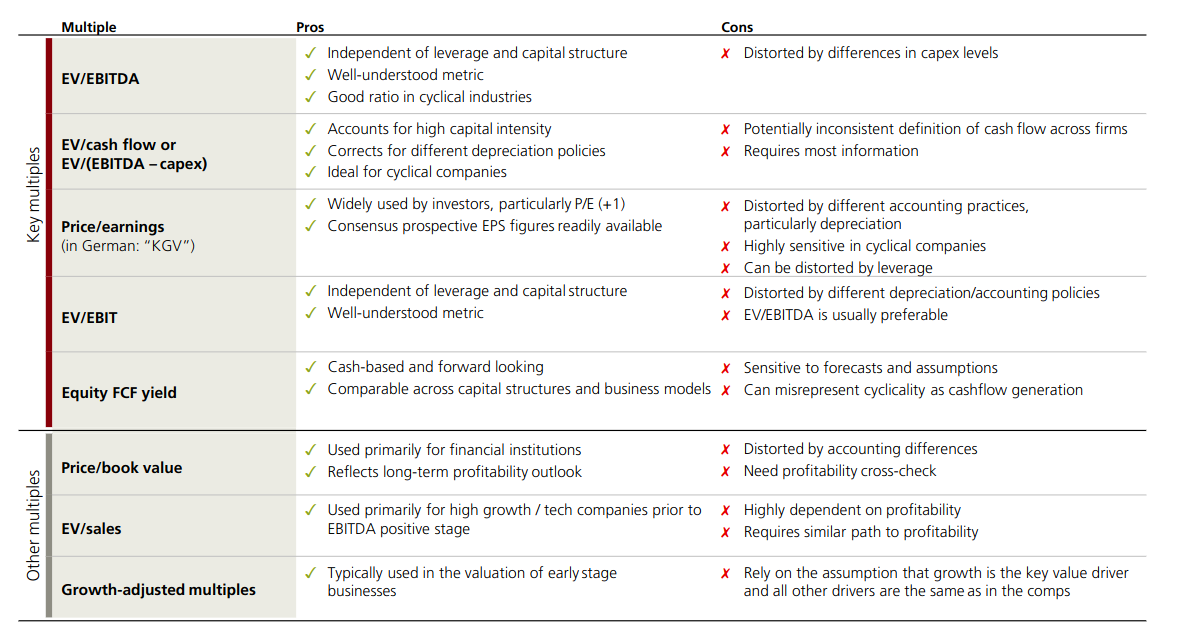
Matching Multiple to Description
-
“Independent of leverage and capital structure; well-understood; good in cyclical industries; BUT distorted by differences in capex levels.” → EV/EBITDA
- capital-structure-neutral, good for cyclicals, but ignores capex differences (hence EV/(EBITDA-capex) for capital-intensive sectors)
-
“Cash-based and forward-looking; comparable across capital structures and business models; but sensitive to forecasts and can misrepresent cyclicality.” → Equity FCF yield
- true cash returns but sensitive to forecasts
-
“Widely used (especially +1); consensus prospective EPS readily available; BUT distorted by accounting practices, depreciation, leverage, and is highly sensitive in cyclical companies.” → P/E
- bottom-line, distorted by depreciation/leverage/taxes
-
“Used primarily for financial institutions; reflects long-term profitability outlook; BUT distorted by accounting differences and requires a profitability cross-check.” → P/B
- primarily for financial institutions
-
“Used primarily for high-growth/tech companies prior to EBITDA-positive stage; highly dependent on profitability and requires similar path to profitability.” → EV/Sales
- for pre-EBITDA growth companies.
Multiples in Short
Cyclicality
EV/EBITDA is better than P/E in cyclical industries, because EV/EBITDA is unaffected by extra leverage taken on during downturns → EV & EBITDA are before taxes
P/E → Earnings collapse at low-turns and surge at the peak, making cycle to cycle and firm/firm comparisons useless.
Familiarity
P/E is widely used and widely compared → familiar to investors
however, it’s also very distorted.
Leverage
- EV/EBITDA is calculated before interest payments, so it sits above the debt line — the multiple is the same regardless of how a firm is financed.
- P/E is computed on net income, which is after interest
- meaning a more leveraged firm reports lower earnings and thus a higher P/E even if the underlying business is identical.
This makes P/E unreliable when comparing firms with different capital structures.
CapEx Levels
EV/EBITDA is influenced by CapEx levels → higher CapEx shrinks EBITDA.
For that we use EV/Cashflow or EV/(EBITDA - capex).
EBITDA ignores capex entirely, so two firms with very different investment needs (e.g. one leasing equipment, one owning it) will look artificially comparable.
Two firms, identical EBITDA of €100m. Firm A spends €10m/year on capex, Firm B spends €60m/year. EV/EBITDA treats them identically. EV/(EBITDA − capex) gives Firm B a much higher multiple for the same EV, correctly reflecting that its “real” cash generation is far lower.
- buy new machine for $ 100m cash
- Cash (asset) - 100m
- PP&E (asset) + 100m
→ Net effect on income is 0 → capex invisible to EBITDA
- Depreciation
- over time, we add the value of the asset
- Depreciation +10m (income statement → reduces EBIT)
- Accumulated Depreciation +10m (balance sheet → reduces PP&E book value)
→ the CapEx spends gets released gradually …
But with EBITDA, we remove depreciation → makes the asset invisible.